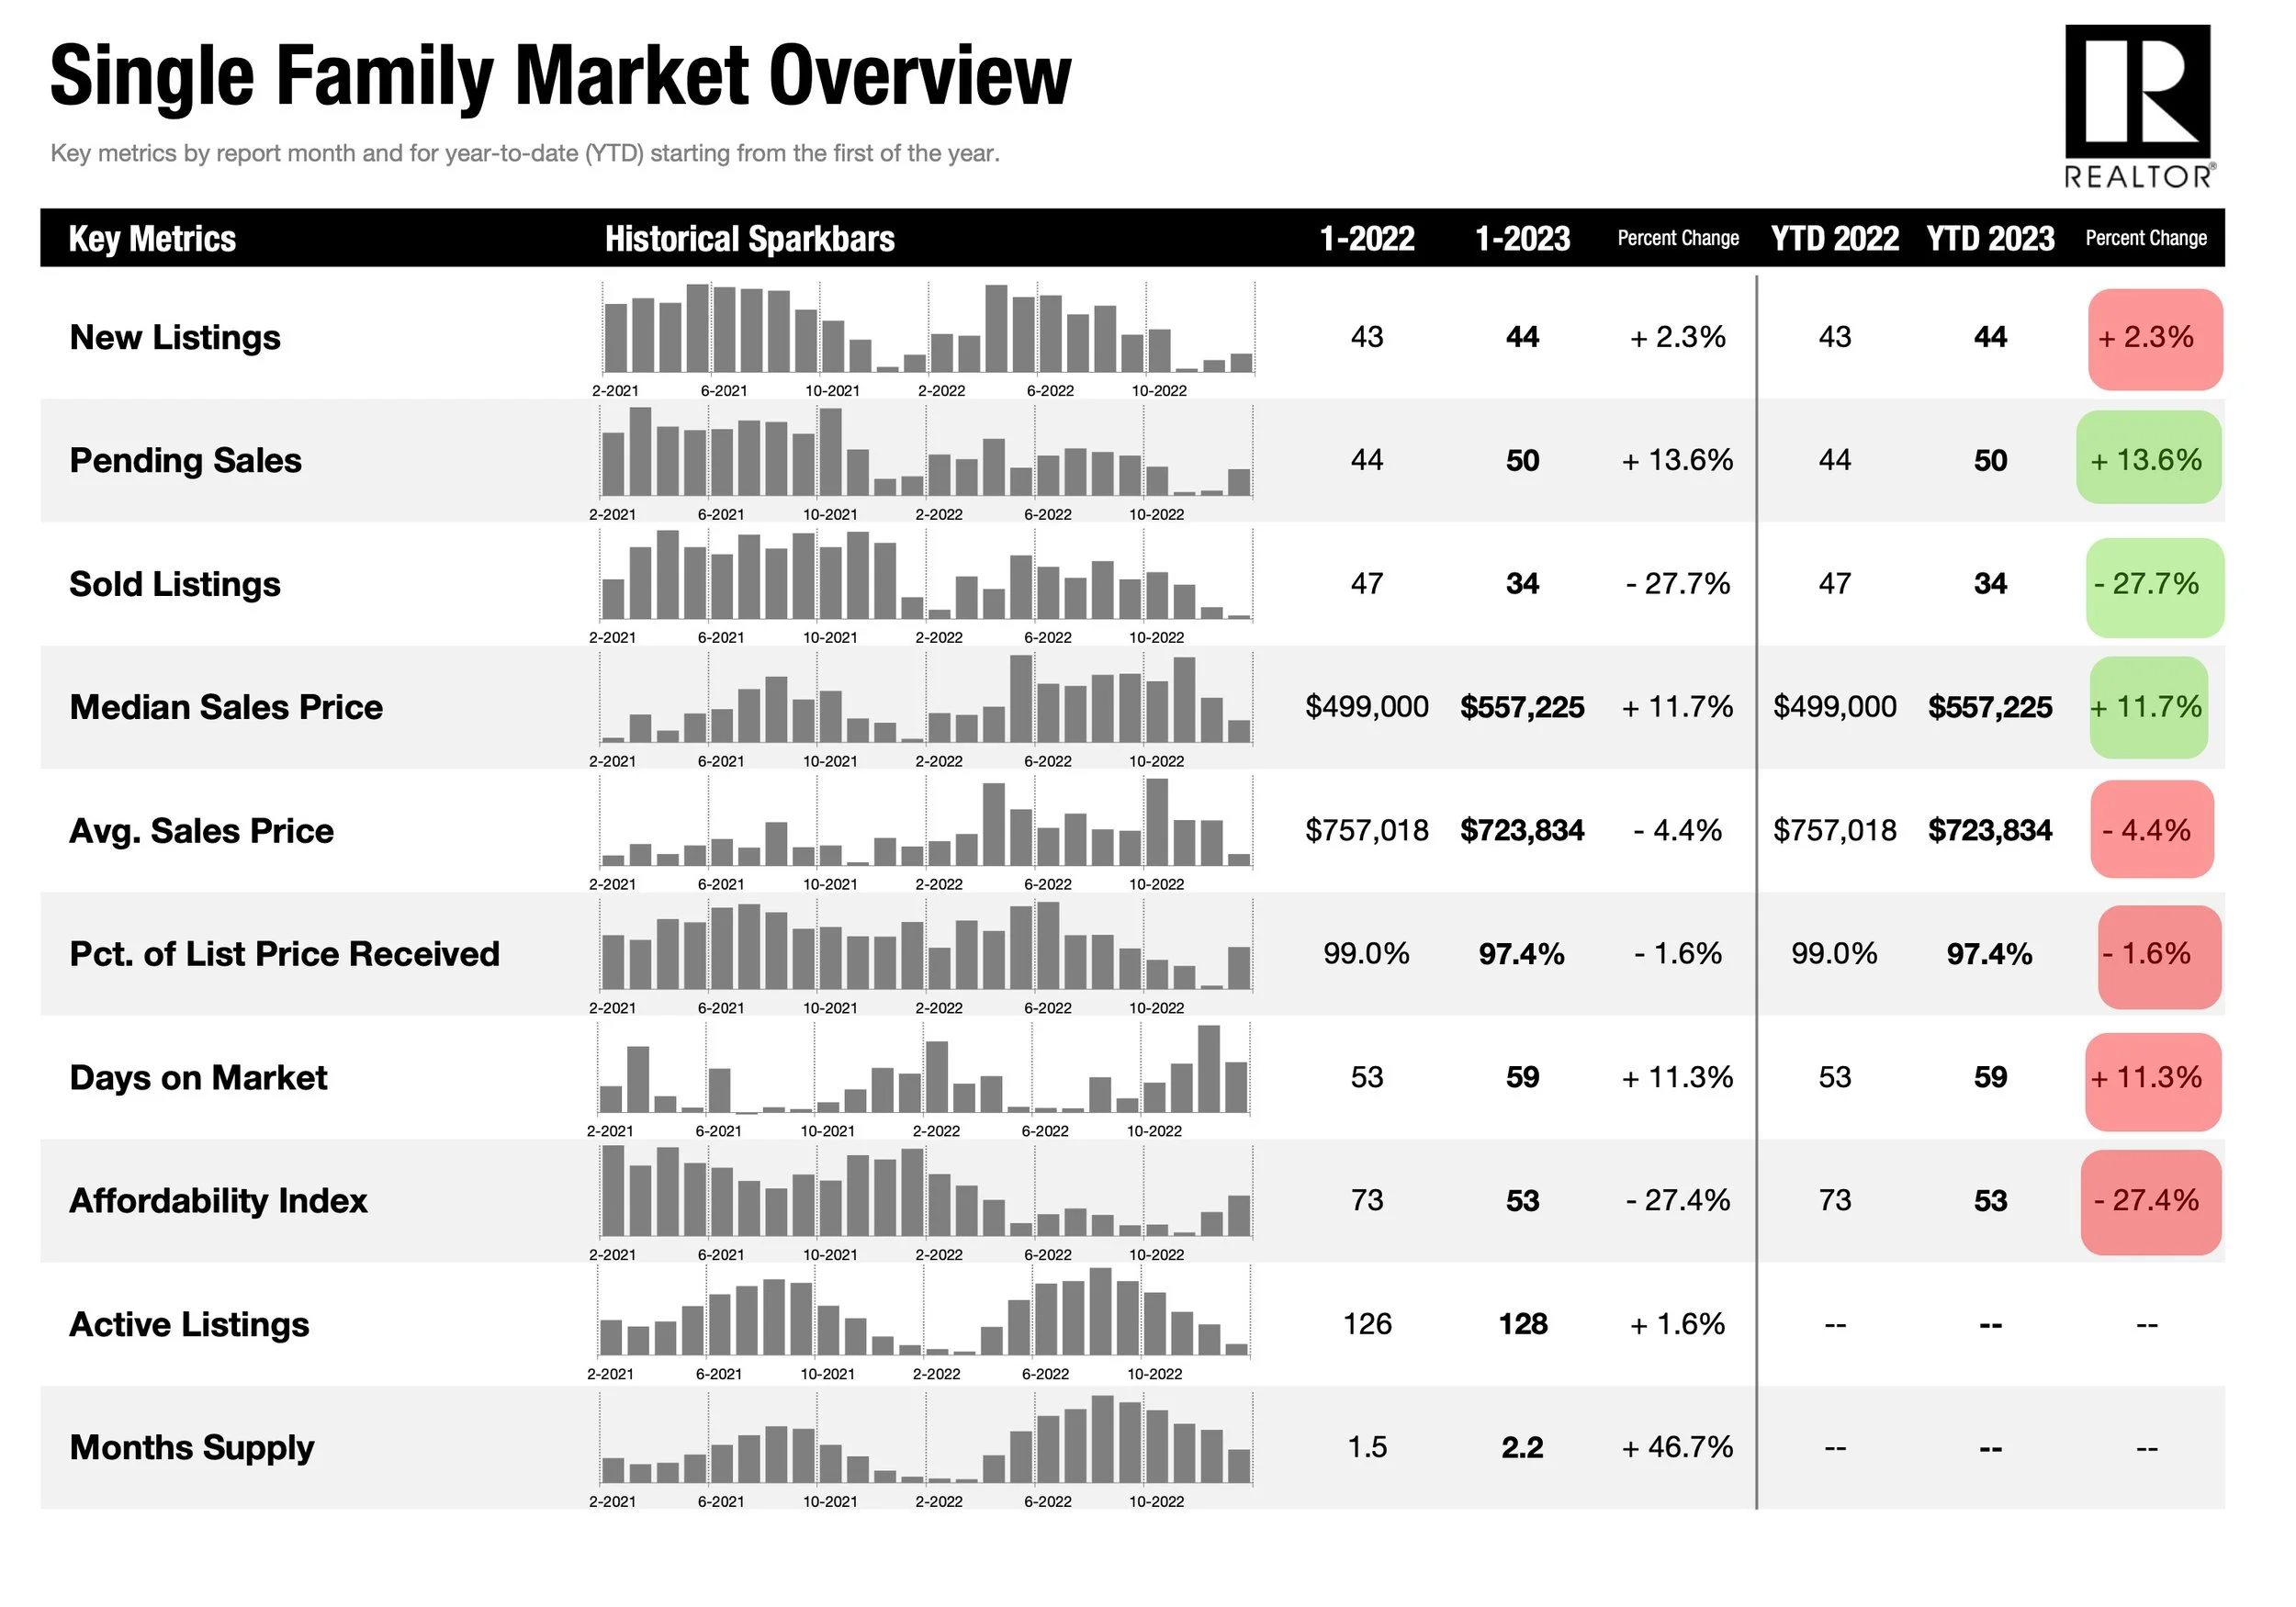
First Market Stats of 2023 - The cooling is finally visible in the monthly numbers
Feel that coldness yet?
It took a while, but the cooling we all felt on the ground is finally visible in the Colorado Association of Realtors numbers. Is this what a crashing market looks like? The short answer is no. The long answer is more complex, and this is a crucial time to stay up to date with the market data.
Main takeaways:
Median sales price in Aspen came down more than 44% year over year!
Median sales price down in Aspen, Carbondale, New Castle
Inventory keeps shrinking throughout the valley
Overall, this is a mixed report that shows a cooling market. Yet don’t fall for crash gurus ringing the alarms! Find below the stats for the area, with numbers with a positive impact on pricing highlighted in green, and numbers with a negative impact on price highlighted in red.
Average price in Aspen down 26.9%, up 17.7% in Basalt… Duh?
This is why we need to take those numbers with a grain of salt. How can prices be down 44% in Aspen and up 25.9% in Basalt? The answer is to be found in the inventory numbers. New listings have been dropping for months, even years, and we are at a level of inventory that has never been seen before. Take Aspen as an example: there were 6 sales in December of 2021 (very low), and only 4 sales in December of 2022! There were exactly ZERO sales of condos in Aspen last month. Consequently, each one of these sales have a huge impact on the average numbers. If one sale out of those 4 is a deed restricted home with a controlled sale price for instance, the average sale price would absolutely plummet.
Example:
During month 1: 4 sales in Aspen: 1 sale at a $20,000,000 price point, 2 sales at $10,000,000, one at $8,000,000: Average price point = $12,000,000
During month 2: sales in Aspen: 1 sale at a $20,000,000 price point, 2 sales at $10,000,000, one deed restricted unit at $1,000,000: Average price point = $10,250,000
Because of just one sale out of the four being off the chart low, the average sale price would show a 11.125% decline.
Overall throughout the area, the median sale price year over year is still up almost 12%.
That being said, the cooling is real
There is no denying that the market is cooling down. Those number would have been unconceivable during the last two years when the market was booming, no matter what the level of inventory was.. What should we look for next?
Inflation numbers: The next CPI report is tomorrow. If inflation numbers come back hot, expect more rate hikes and a further decline in real estate prices especially down valley where financing is more common.
Stock market trends: If the stock market declines, we will see further declines in price up valley.
Mainstream media headlines: with the first year over year decline finally coming out in the statistical report across the country, the mainstream media will likely have a field day inviting real estate “experts” to elaborate on the reasons why this decline is happening, and the crash gurus will have the spotlight right on them. If this happens and lasts, the sentiment will turn sour amongst real estate buyers and sellers. It could push sellers to list their property sooner rather than later, which will increase the inventory, and potentially list at a more aggressive/lower price. In the mean time, buyers could get cold feet and be more conservative in the offer or pull out of the buying process completely. This would basically be an inversion of the market conditions we have experienced over the last few years, and that have pushed prices up during that time.
The next few months will be crucial… I’ll keep the blog active to make sure you get the best info in real time!
Stats per town


